View

A Google Ads Account Rebuilt Around What Actually Earns
Advertising / Google Ads
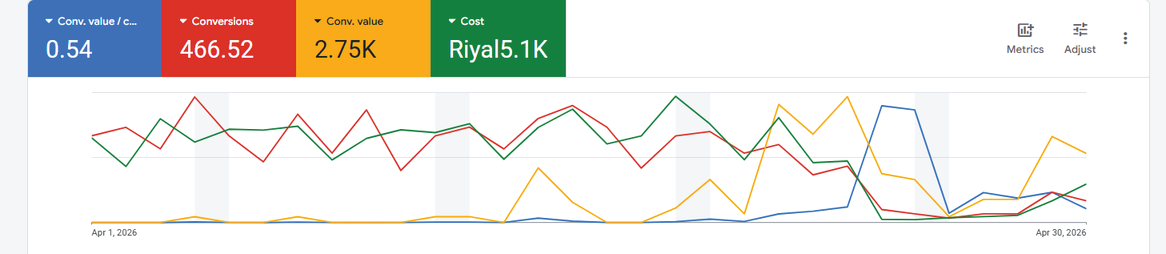
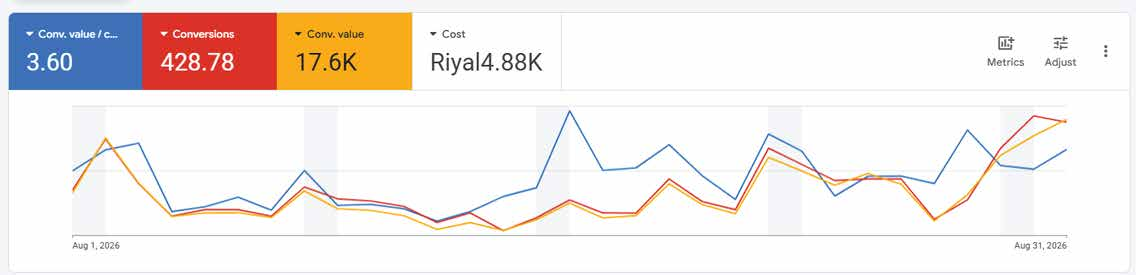
Two monthly snapshots of the same advertising account. In April 2026 it returned SAR 2.75K of reported conversion value on SAR 5.1K of spend. In August, after the campaigns were rebuilt around the products that earn, it returned SAR 17.6K on SAR 4.88K. The client is not named in the source portfolio, so we do not name one.
- Conversion value / cost
- 0.54× 3.60×
- Reported conversion value
- SAR 2.75K SAR 17.6K
- Advertising cost
- SAR 5.1K SAR 4.88K
Google Ads, 1–30 April 2026 compared with 1–31 August 2026. Conversion value is the figure the platform reports, not audited revenue.
Both Dashboards, Unedited
The metric named Conv. value / cost is the platform's reported conversion value divided by what was spent to get it. It is commonly abbreviated ROAS. It is not profit, and it is not audited.
Fewer Conversions. Far More Value.
Read the conversion counts and the story gets more interesting: 466.52 before, 428.78 after. The account did not start converting more often. It started converting on things worth more, which is what happens when spend moves off cheap traffic and onto the products that carry margin.
Those counts are fractional because the platform attributes fractions of a conversion across interactions. They are a modelled figure, not a count of people, and anyone presenting them as customers is misreading their own dashboard.
The two months are four months apart and were not run as a controlled test. They show what the account reported in each window; they do not isolate a single cause.
What We Delivered
- Account Audit
- Campaign Restructure
- Product and Audience Targeting
- Ad Creative and Copy
- Bid and Budget Management
- Conversion Tracking Review
- Monthly Performance Reporting
Spending Less and Earning More Is a Structure Problem.
Most underperforming accounts are not short of budget. They are pointed at the wrong things.